Demo-graphic
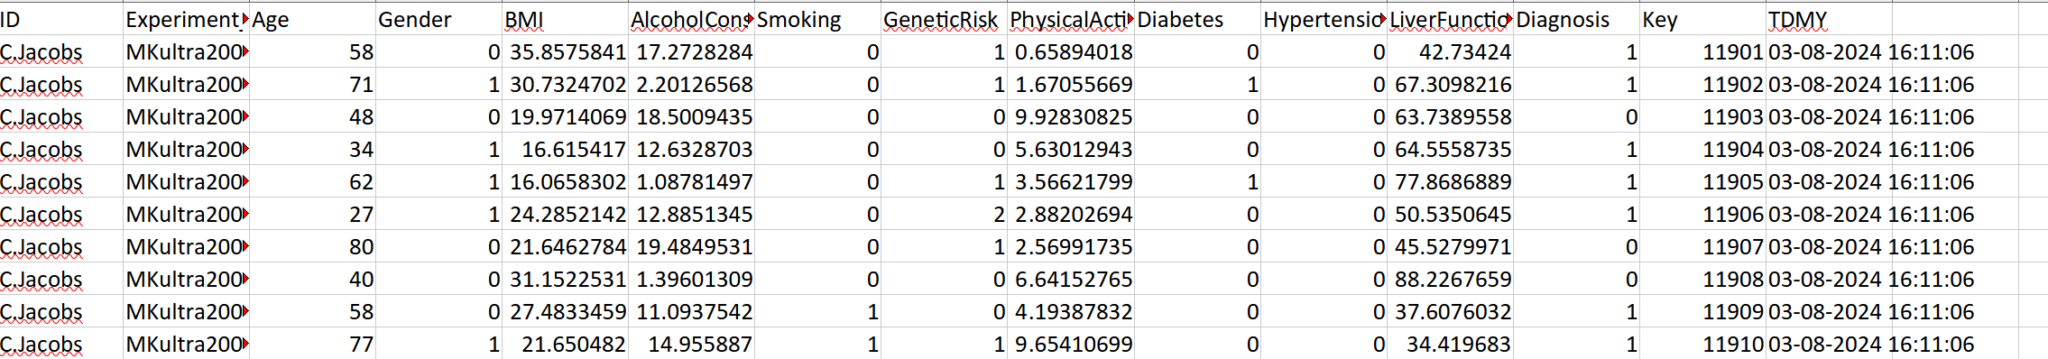
The first project i completed is called Demo-Graphic. This is a dashboard programmed in R that uses demographic data from Kaggle on liver disease. Within the dashboard it is possible to interact with the database, analyze data, filter data, download reports and manage data and users.
UPLOAD DATA
Demo-graphic includes an upload panel that adjusts the column structure and ensures data integrity during the upload process to the database.
SQLite DATABASE
Experiment data and user data are stored in an SQLite database, with user information encrypted for security.
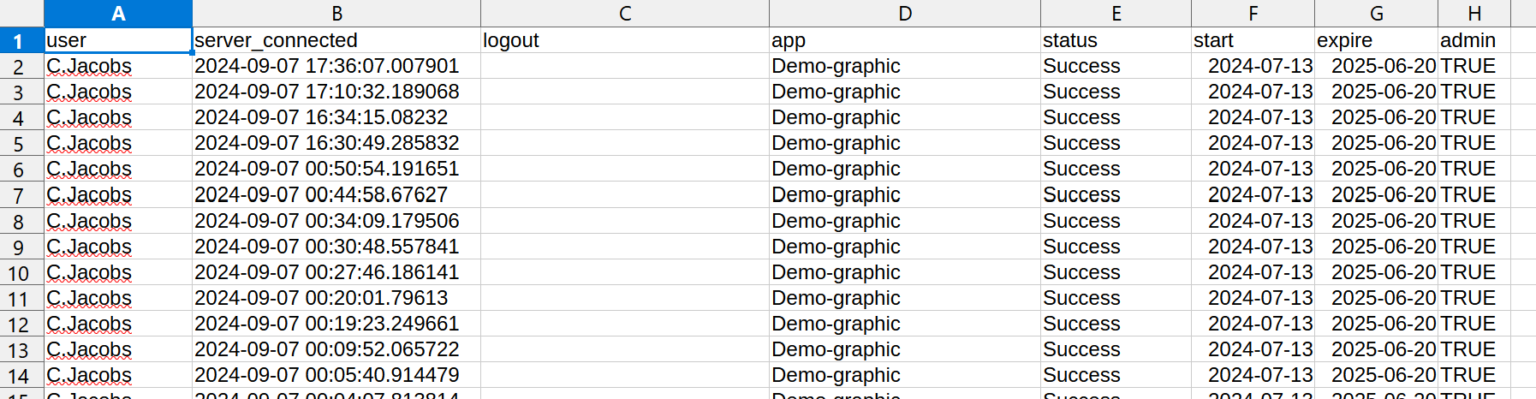
DATA/USER MANAGEMENT
User and experiment data can be managed through an admin account. Faulty entries, which are uniquely identifiable, can be removed with administrative privileges.
FILTER DATA
For analysis, it is important to filter relevant data, a feature available within the interface
ANALYSIS
Various graphs and images can be generated for analysis, allowing the investigation of frequency distributions and correlations.
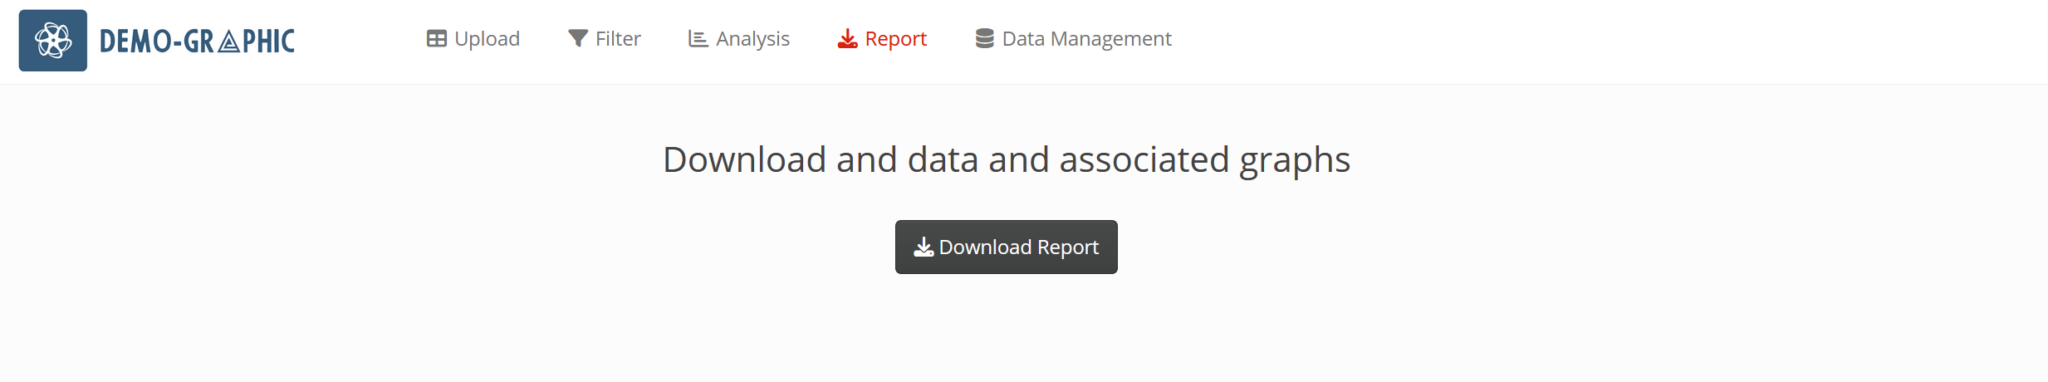
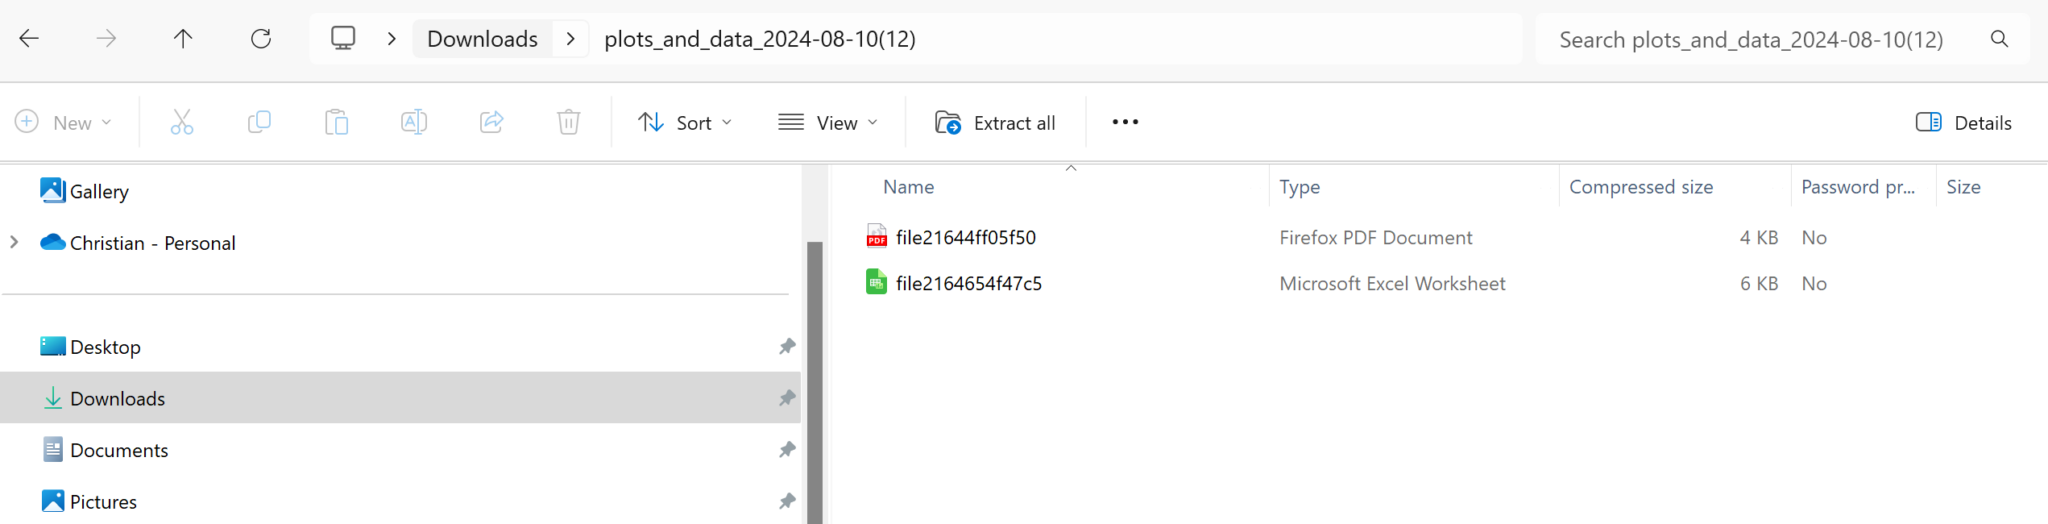
REPORTING
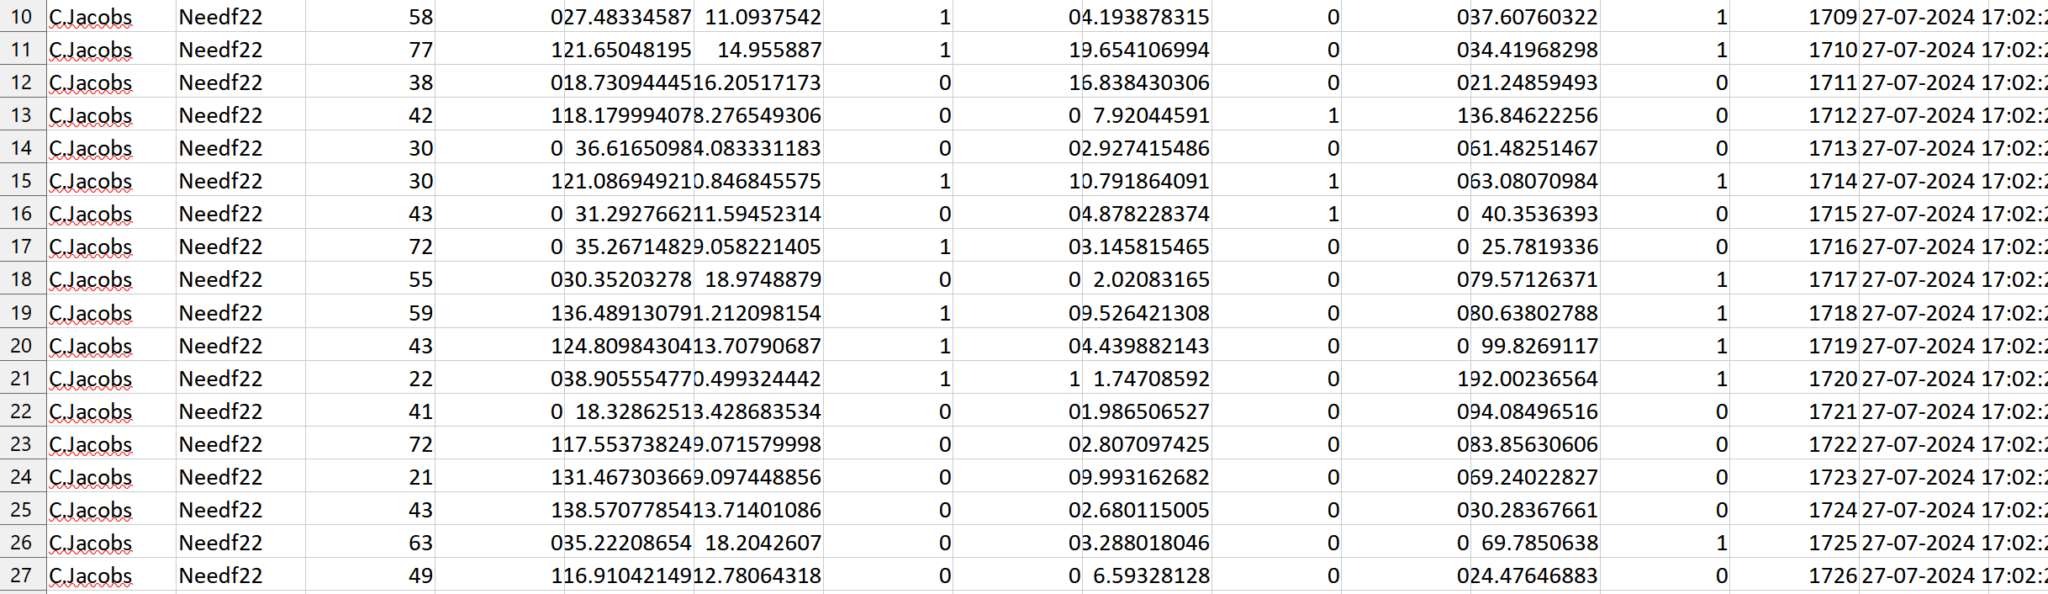
A report can be downloaded containing all the filtered data and the generated graphs.